


Japanese SAKE international market report summary 2019
2019 was a successful year for Sake* exports and there was a remarkable growth over a year.
On this page, we summarize the market situation of Sake export from Japan to all over the World.
This time you will find the statistical data of the topic below;
- World overall exporting volume and value amount of Sake 2019
- Exporting volume of Sake by Area of the World 2019
- Ratio of Sake exporting volume by Area of the World 2019
- Average FOB Price of Sake 2019
- Exchange rate 2019
Please find the market summary from below;
Contents
1. World overall exporting volume and value amount of Sake 2019
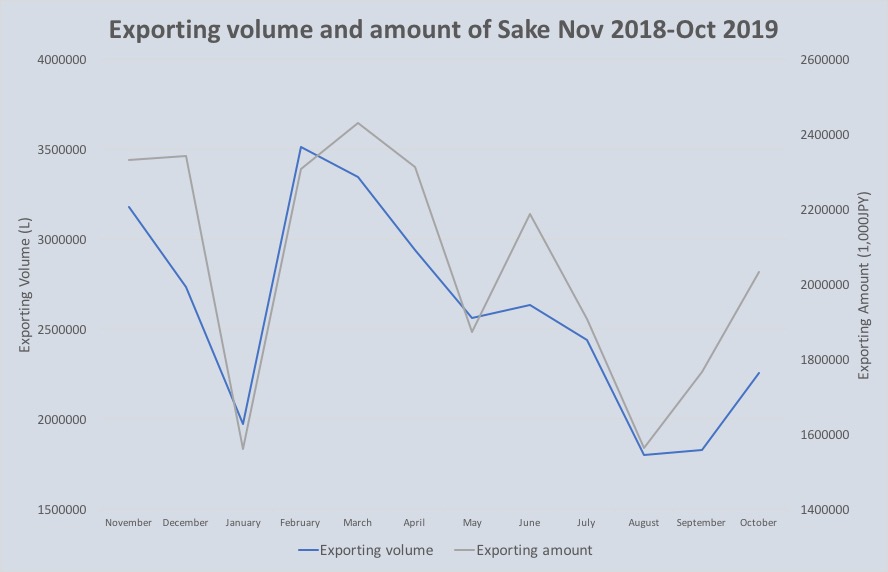
The graph above shows the change in Volume (in liter) and Value amount (in JPY) of Sake exported from Japan in the period of November 2018-October 2019.
As you can see from the graph, Sake has a tendency of SEASONAL PRODUCT. As Winter comes(most of the exported countries are located in Northern Hemisphere) volume and price increases.
In addition, price follows the volume, as volume rises price also rise. It seams that as volume increase consumers expects varieties so the high-end products also export in the period.
One of the interesting tendency you can find from the graph is that from April volume decreases. It means this is the season for the promotional event and fair, so less export in this season.
(Please find how breweries live through a year from the link: click here)
2. Exporting volume of Sake by Area of the World 2019

The graph shows exporting volume of Sake during November 2018-October 2019 by area of the world.
Obviously, Asia has the largest proportion and occupies more than half, almost 2/3, and you can see how Sake export is relying on East Asia from the graph of 3.
According to the population, U.S. has more potential and Europe as well.
3. Ratio of Sake exporting volume by Area of the World 2019
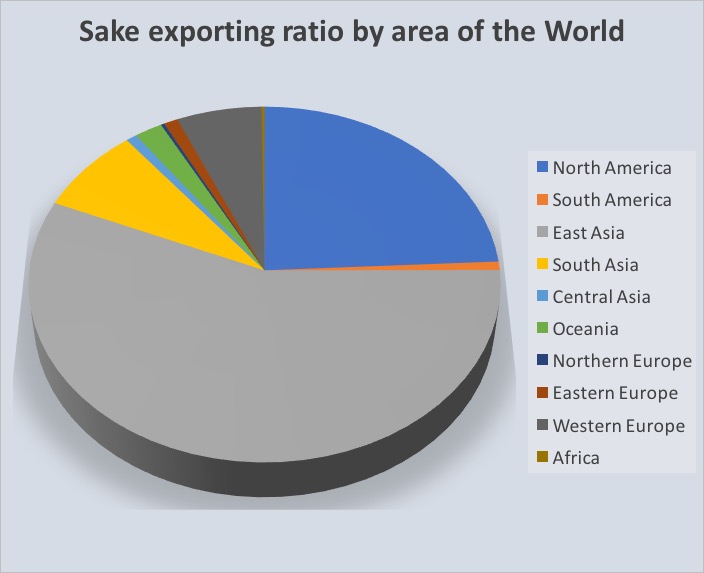
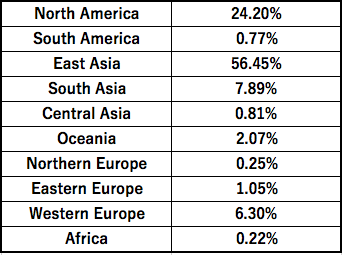
The graph and table above shows the proportion of Sake export by areas of the world.
As mentioned above, East Asia has the largest proportion, and North America as follow.
It means there are a lot of potential in the rest of the world!!!
4. Average FOB Price of Sake 2019

The graph above shows the change in average FOB price of Sake from November 2018-October 2019.
As you can see, high season in Winter has the higher price than Summer season.
5. Exchange rate 2019
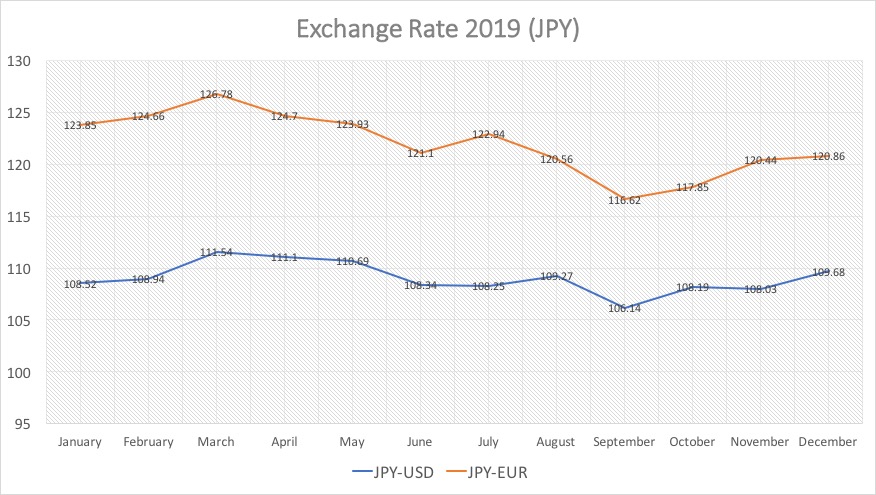
The graph above shows the change in exchange rates of USD and EUR in 2019 in JPY.
The rate gradually lowered, but mostly stays the same especially USD.
Hope the information is useful for you.
ikki will construct “Statistics page” for the monthly report so please looking forward to the update.
Thank you for your time!
(Ref. Ministry of Finance Japan)
*Data of Sake is the product in HS code 220600.


