【SAKE STATISTICS】Japanese Sake Market Report July 2020
Please find the updating market report of July 2020. As the data is available slightly late, this month ikki will deliver the statistics of May 2020.
To be precise, Sake on the data means exported products from Japan under HS code of 2206.00.
The data you can find is as below;
- Total exported volume and value May 2020
- Exported volume by area May 2020
- Exported amount by area and its ratio May 2020
- Average FOB price May 2020
- Exchange rate July 2020
Please find the data below.
Contents
Total exported volume and value May 2020

Finally, the export started to slip down. The exported volume and value is at the lowest point through a year.
The monthly export volume dropped down to about 1,230,000L and amount to about 1,200 MILLION JPY on May 2020.
Exported volume by area May 2020
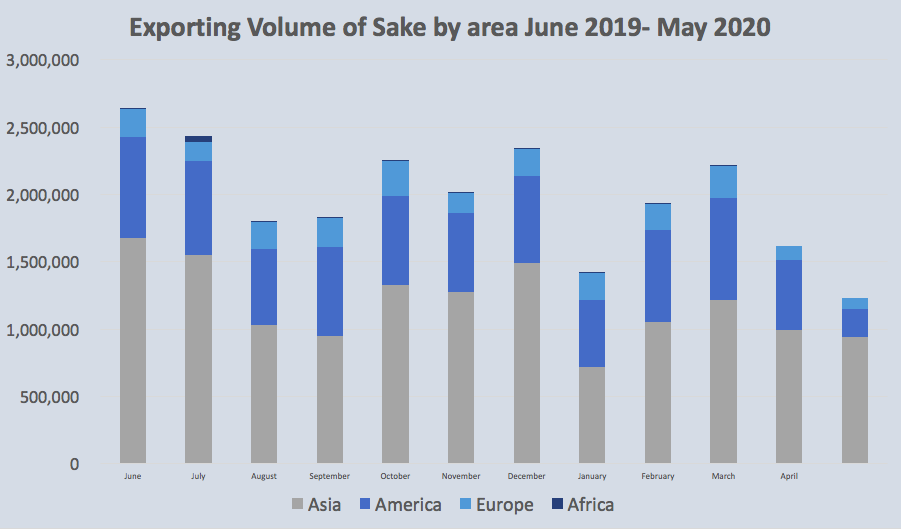
Export to Africa stopped for 2 months and the volume slowly going down every month.
Exported amount by area and its ratio May 2020
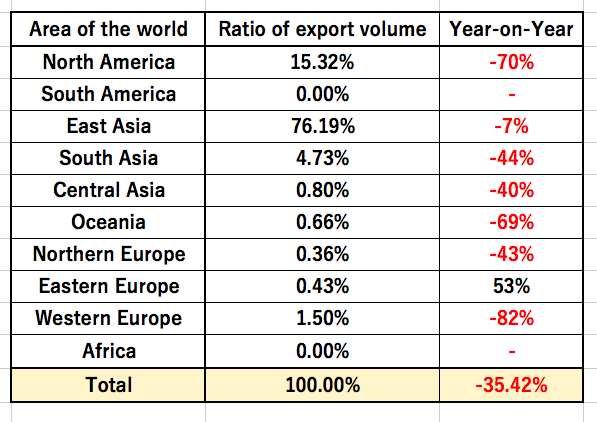
When we look at the area more smaller scale, there was no export to South America and Africa.
In Eastern Europe it seams increasing, but there was not much export in the last year.
The situation is not getting better.
Average FOB price May 2020
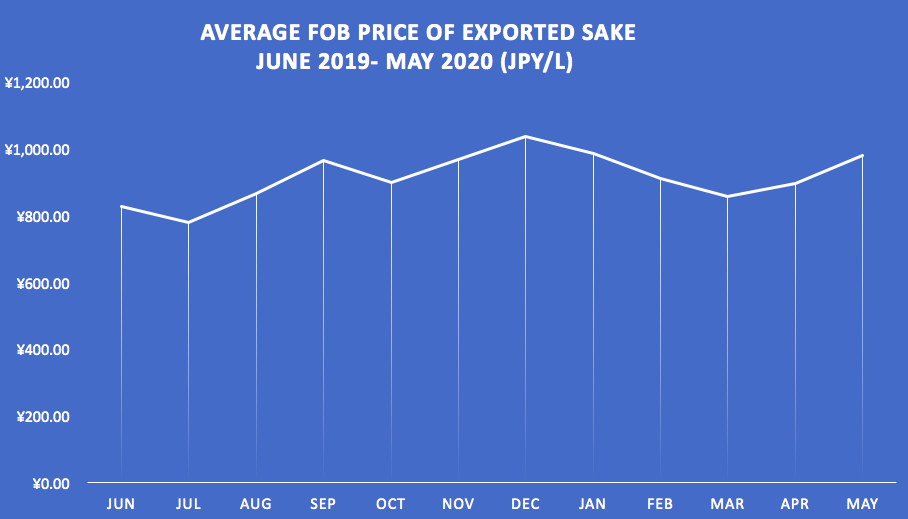
On the other hand, average FOB is increasing.
It can be read as less economy of scale in logistics, but also the one who enjoy Sake now is understanding the value of Sake as well.
Exchange rate July 2020
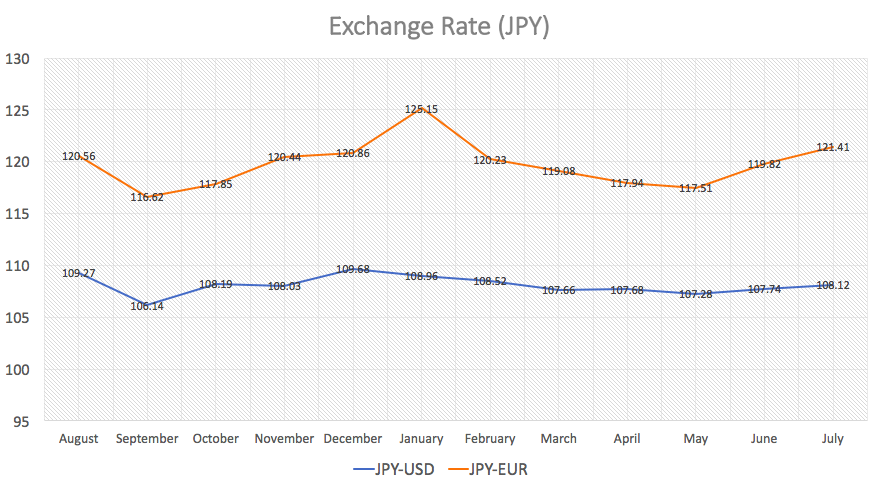
From the graph, we can read as JPY is slowly decreasing the power , but not dramatically in JPY-USD.


