
Japanese Sake Market Report June 2020
Please find the updating market report of June 2020. As the data is available slightly late, this month ikki will deliver the statistics of April 2020.
To be precise, Sake on the data means exported products from Japan under HS code of 2206.00.
The data you can find is as below;
- Total exported volume and value April 2020
- Exported volume by area April 2020
- Exported amount by area and its ratio April 2020
- Average FOB price April 2020
- Exchange rate June 2020
Please find the data below.
Contents
Total exported volume and value April 2020
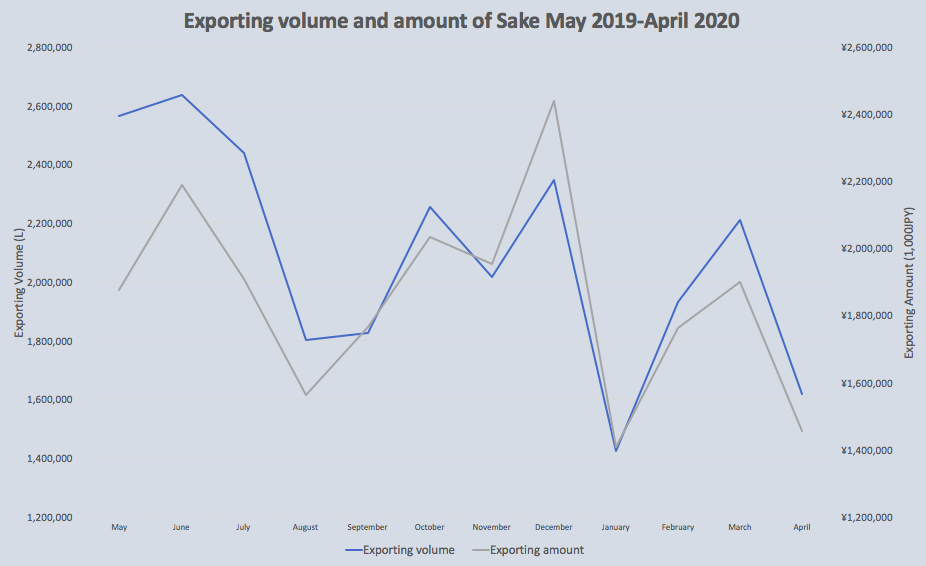
The export volume and amount of Japanese Sake hugely declined on April 2020 to about 1,600,000L at 1,450 million JPY.
From the graph, we can read that the influence of coronavirus has started from this month in real.
Exported volume by area April 2020
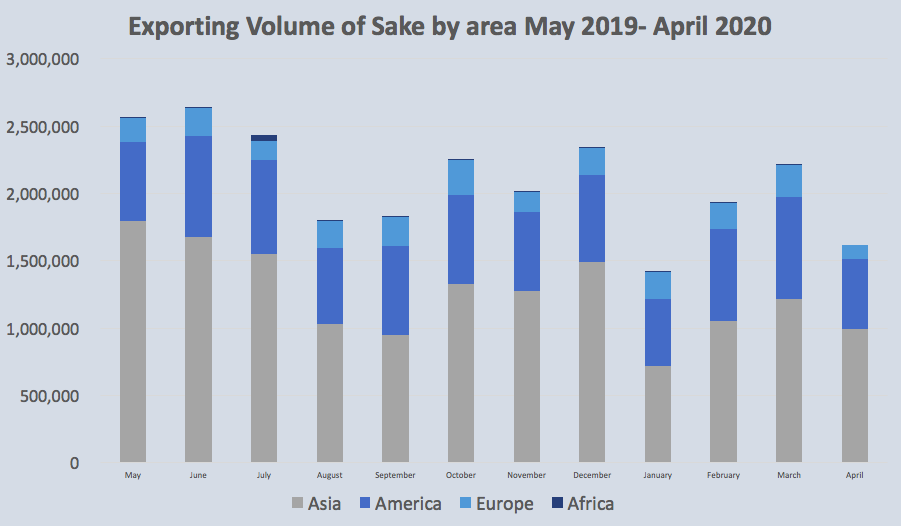
Overall, the volume had been decreasing, but since January 2020 the fall in exports to Asia is remarkable.
As you can see, it would be almost half amounts comparing to the last year in the next month.
Exported amount by area and its ratio April 2020

All in red and no export to Africa.
Nevertheless, there is less impact in Northern Europe.
In addition, the percentages in volume area; North America/East Asia, are smaller compared to the other areas. There should be great distributors and customers in the market already.
Average FOB price April 2020
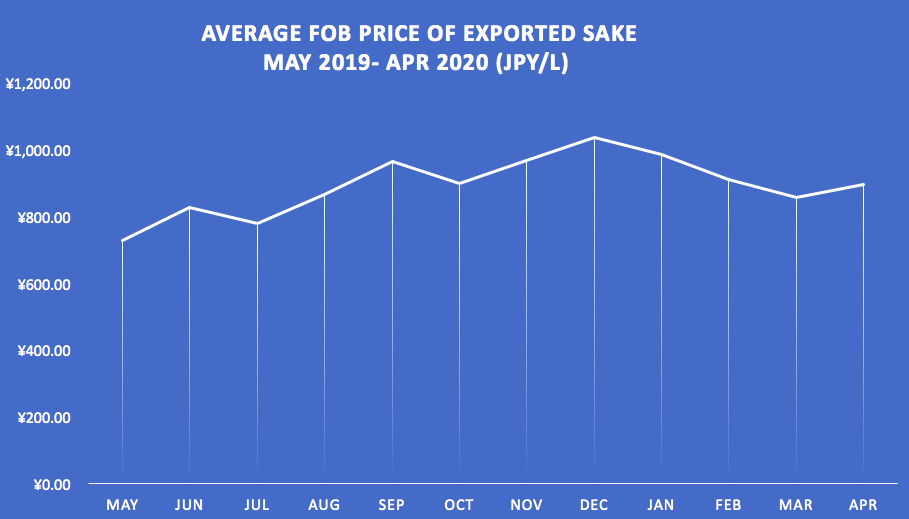
Average FOB went up slightly.
It might be because frontier markets are terminated, and active market is still working. So, the customers in active market can find values in Sake more.
Also, it might be the influence of restaurants and bar closure. High-end outlets with may repeaters can survive in this harsh situation more than outlets for volume zone.
Exchange rate June 2020
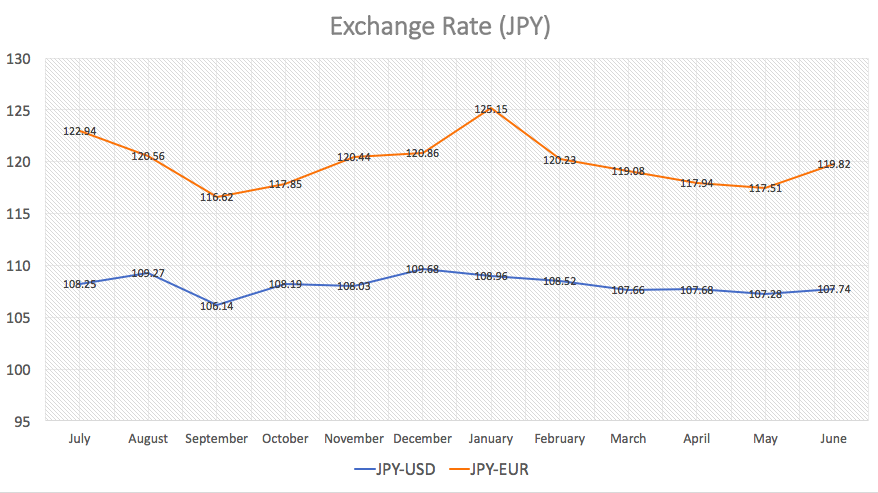
Slightly inflated.
As you can see from the stock market information, US stock market started to move positively from June so there should be some influence from the market.
*The rate is TTM on the first business day of the month
(Ref. Ministry of Finance)


